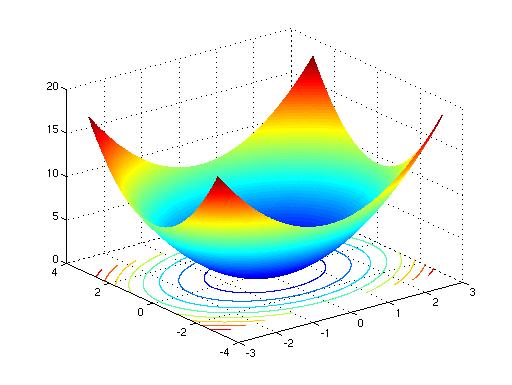
z = x^2 + y^2
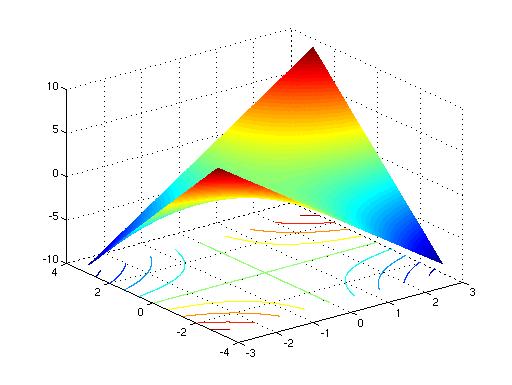
z = xy
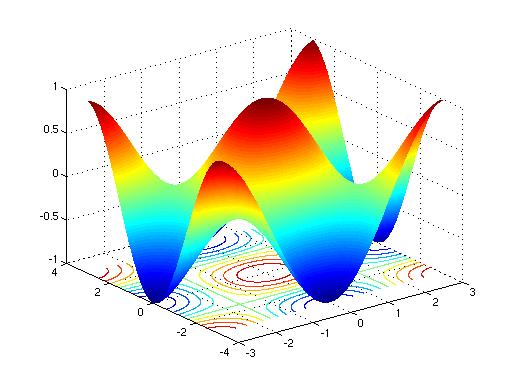
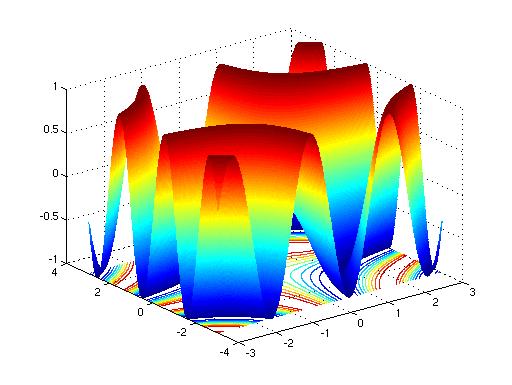
z = cosx*cosy
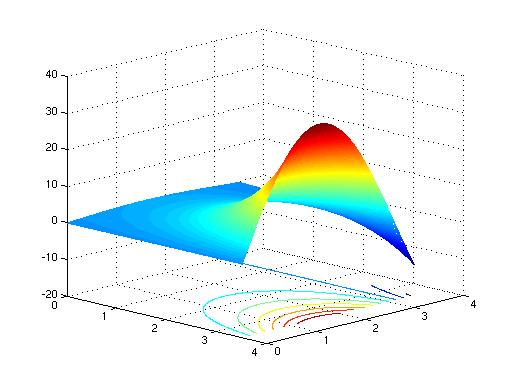
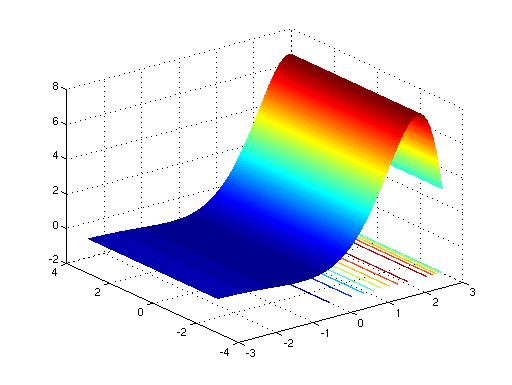
z = e^x siny
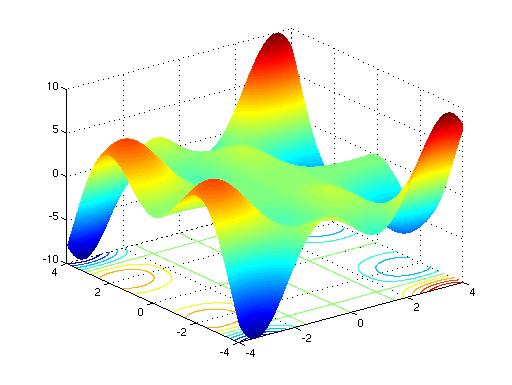
z = xycosxsiny
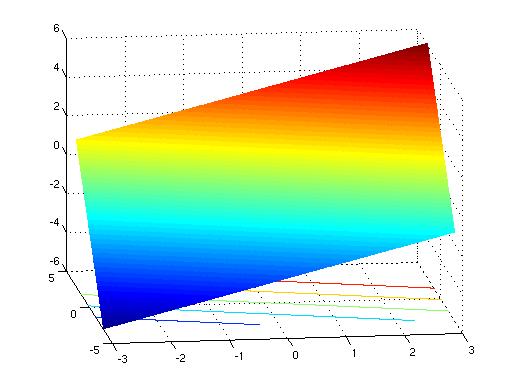
4z = 3x + 5y
z = sin(xy)
z = e^x sinx

z = sqrt(x^2 + y^2)*cos(x^2 + y^2)
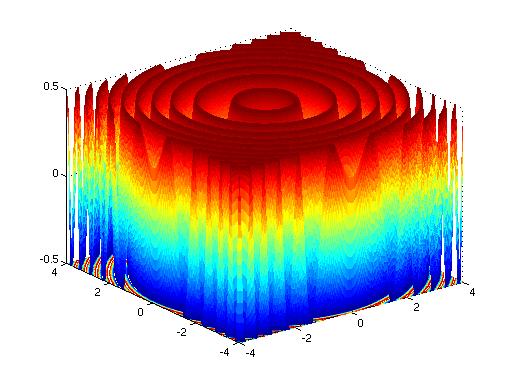
z = cos(x^2 + y^2)sin(x^2+y^2)
z = x^2 + y^2 |
z = xy |
z = cosx*cosy |
z = e^x siny |
z = xycosxsiny |
4z = 3x + 5y |
z = sin(xy) |
z = e^x sinx |
z = sqrt(x^2 + y^2)*cos(x^2 + y^2) |
z = cos(x^2 + y^2)sin(x^2+y^2) |